
Running performance benchmarks measures systems under real load, but takes a fair bit of effort. Simulations can help understand the characteristics of a system with a lot less effort (and somewhat less accuracy). For this blog post I knocked up a quick PHP script to simulate random hits to a page cache to explore the likely behavior of a cache given different loads and profiles.
If anyone has real data they can plug in, with cache hit rate metrics to go with it, I would love to hear about it to review the impact on more accurate data on the simulation.
Scope of Exploration
First, to be clear, this blog only deals with cacheable resources.
- There are CSS and JavaScript files, but there are not many of them.
- There are images which do not change often even if the product is updated, where one product will have multiple images. If you are doing image resizing on demand, this can chew up a reasonable amount of CPU.
- There are product pages.
- There are category browse pages, search results, and more.
I am going to stick to product pages here as this is more of an exploration of cache behavior than a benchmark. Product pages need to be refreshed in the cache if any detail of the product changes.
Probability of Access of Cacheable Resource
Not all product pages are equal. You have best sellers, flash sales, featured products, and so on. The simulation used assumes different products have different probabilities of access. I used a highly scientific and deeply thought about approach – I allocated the relative likelihood of a product being accessed of 1/2, 1/3, 1/4, 1/5, and so on. So if you have 1K products the last product is around 1/1000 (or 500 times less likely to be accessed that the most popular product at 1/2). Normalizing into probabilities, the graph for a 1K product catalog is as follows.
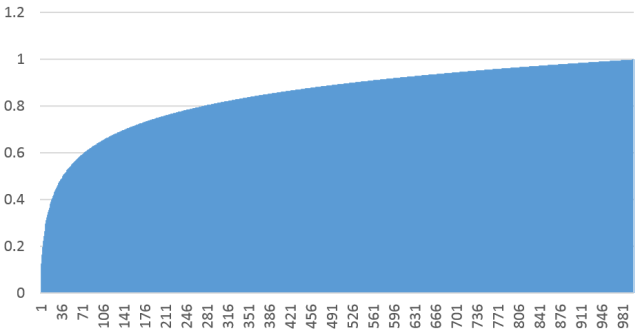
This is a cumulative probability graph showing the top 40 products make up around half the accesses for a 1K catalog.
The graph for 10K products is a bit steeper, with the top 125 products making up around half the accesses for a 10K catalog.
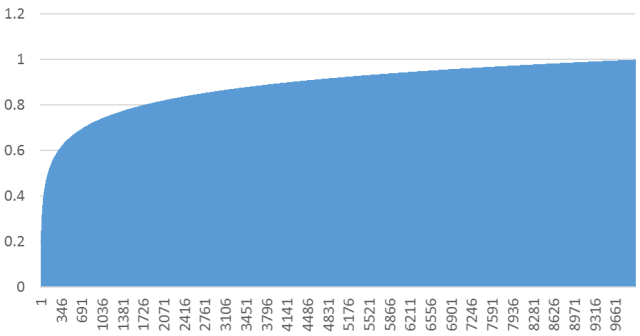
The 100K catalog is steeper again (not shown here).
Obviously for the simulation to be accurate, it is important for the above curves to match reality. This is where you need to understand the access patterns of your own site. Feedback on real-world distributions welcome!
Day/Night Access Patterns
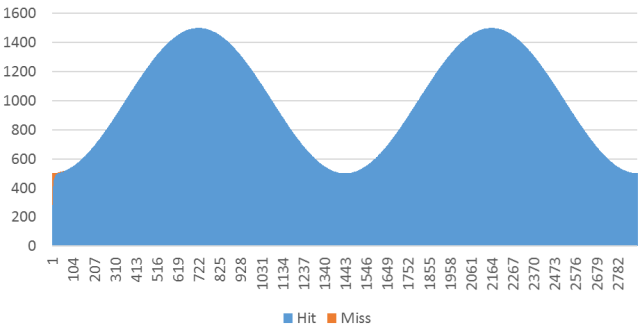
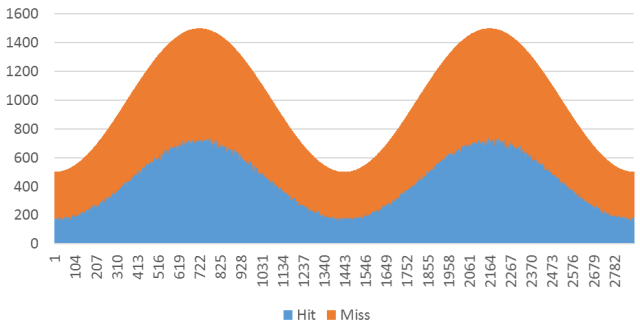
The average requests per minute is not constant during the day. For the sake of these simulations, a sine function was used where the peak is 50% higher than the average and the low point is 50% lower than the average. Most tests simulate 2 days of traffic.
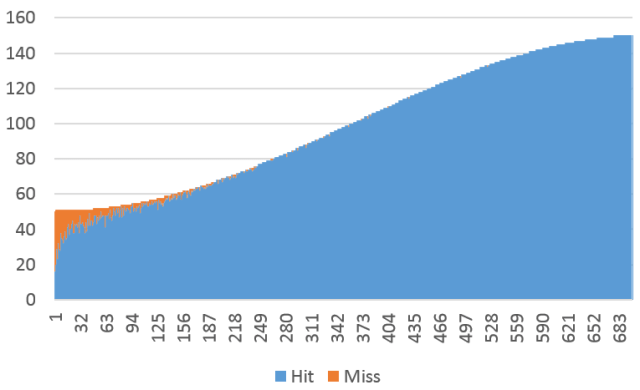
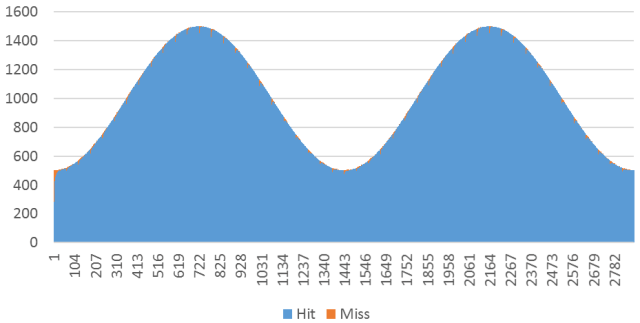
The following graph shows the cache hit/miss rates for 1K products with 1K accesses per minute. The x-axis is in minutes and the y-axis is number of requests. As expected, the cache fills pretty quickly. (Notice the small orange blip at the start of the graph.)
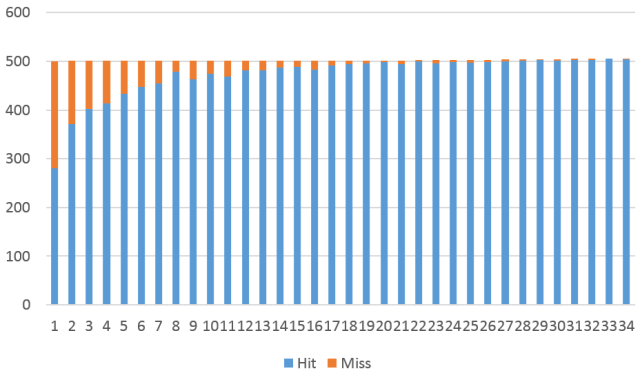
The following graph expands the first minutes of the day. Note that 1K requests per second does not guarantee all entries are hit in the first minute – the same entries are hit multiple times. The graph shows the cache miss rate drops pretty quickly.
Cache Hit/Miss Rates with no Updates
Let’s explore a few more hit/miss graphs assuming no product updates occur. It is worth remembering this is modeling arrival rates of requests, assuming there is sufficient hardware to cope. The issue is to get a feel for how long the cache misses will occur, and what percentage of misses occur. Your site will need sufficient hardware to process all uncacheable pages (such as checkout pages) plus keep up with spikes of cache misses.
The following graph shows dropping to 100 requests per minute. As you can see the cache takes longer to fill, as would be expected. But there would be such a low load on the server (e.g. 40 requests per minute) it is not a particularly interesting case to explore further.
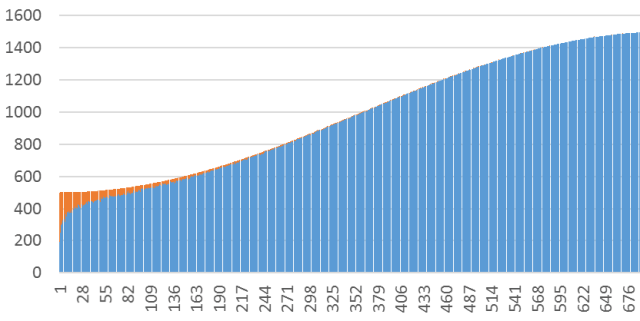
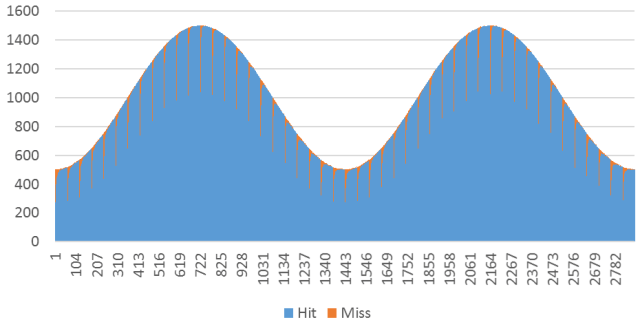
Moving on to 10K products with 1K accesses per minute, we get the following graph. (At 10K requests per minute, the cache fills so quickly it is not a particularly interesting graph so omitted here.) As can be seen, the cache takes longer to fill due to the long tail of less frequently accessed products. Since hardware needs to cater for the worst case spikes, this longer tail is not necessarily an issue when sizing hardware requirements.
But it does show that after 10 minutes the cache hit rate is still quite bad, after 30 minutes the cache miss rate is somewhat high, and it takes more like 2 hours before it settles into the noise.
What does this mean? It means when sizing hardware you need to take into account the cache miss rates more seriously if you care about customer experience during say the first 10 minutes after the cache is completely wiped. It also means that if you decide to do benchmarking, you cannot take the first 10 minutes (or even first hour) as an indication of average performance across a full day.
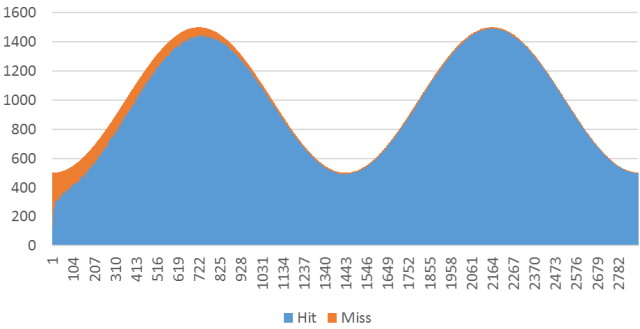
Next, let’s look at the curve of 100K products. (My crude script took around 8 hours per run here.)
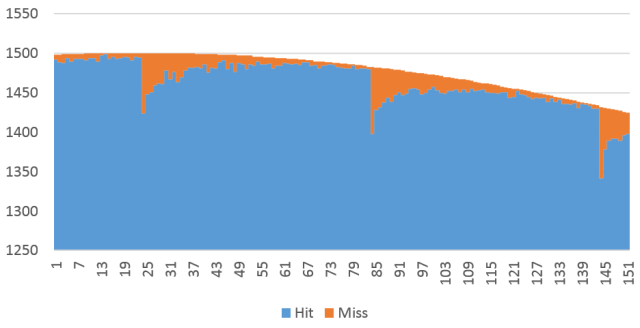
Showing this graph as percentages (showing the percentage of misses to hits) makes the percentage of cache hits/misses easier to read.
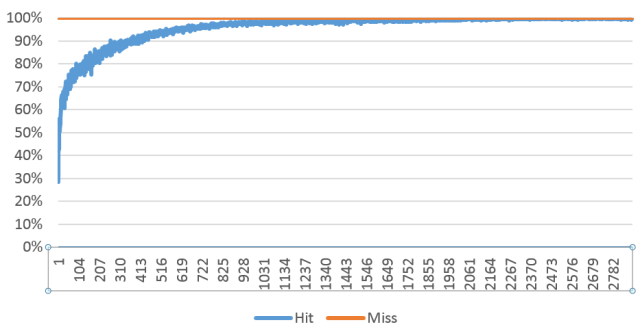
The above graph shows a 50% cache hit rate is reached after around 6 minutes; 60% at 15 minutes; 70% at 45 minutes; 80% at 140 minutes; 90% at around 6 hours; 95% at around 10 hours; and a full day is required to hit 99%. (A reminder that this is nothing to do with server performance. This is an arrival rate of 1K requests per minute with a 100K catalog will take that long for those pages to be accessed – based on the original assumption of access probability of different products.)
Introducing Product Updates (Cache Purges)
In real life, you typically don’t go live with zero updates to content. So let’s now explore the impact of product updates on cache hit rates.
For this simulation, a percentage of the cache is selected to be purged, then an even distribution across all product probabilities is purged. But it is guaranteed that the selected percentage is purged from the cache. This is done as an atomic operation (which is not realistic in real life – updating products takes time, purging cache entries takes time, and so on).
There are different strategies for implementing product updates. Given the cache fill rates, individual real time product updates won’t be noticeable. Even 1% of whole product catalog updates in a batch are barely noticeable on the graphs. So the following graph shows a 1K catalog with 100 product updates (10%) per hour.
If you look carefully, you can see slight blips on the graph. (Unsurprisingly, the graph looks the same with a 10K catalog with 10K requests per minute.) Let’s push on to 100% (the whole product catalog) being updated every hour, again for a 1K catalog with 1K requests per minute.
Based on the arrival rate of requests, you can see there is greater need to take the cache miss rate into account when sizing hardware. At peak (1.5K requests per minute) there was a minute where almost 500 requests arrived that were cache misses. These spikes were however somewhat short lived (e.g. around 5 minutes long).
To me this is an encouragement to optimize the catalog update process. If you have a process where you simply dump and blindly update the whole catalog every hour (e.g. to get stock level updates), you can expect a greater impact on your site. One simple solution is to compare the new and old values and only actually update the product record if values have changed, or only purge the cache entry if the product details changed “significantly”.
But this test was only 1K products. Let’s move on to some bigger collections.
The following graph shows a 10K catalog with 1K requests per minute (10K requests per minute fills the cache faster, so is not shown here).

That is a bit hard to see, so let’s zoom in.
So at highest peak (1.5K requests / minute) around 100 extra cache misses occur briefly, but it does take an extra 15+ minutes to really settle down. That is a significant duration. So while you might gloss over a spike during the night as not worth spending extra money for hardware on, if you update 10% (which is pretty high) of a 10K catalog every hour then it is worth taking into account.
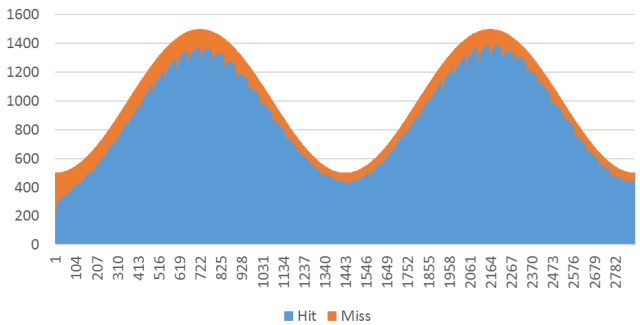
Okay, so let’s go crazy and push this one to the extreme. Let’s move on to 10K products with the cache being completely wiped once an hour.

Here you can start to see much more serious impact due to the length of the tail – the system never gets a chance to fill the cache. There are numerous very serious spikes throughout the day. Morale of the story? Avoid wiping the whole cache so frequently if you have a significant number of products!
This graph does show another effect however. If you do a code deployment at peak time during the day and requires a full cache flush, the number of cache misses is significantly higher than doing it off peak (due to the higher traffic level). So one consideration when sizing hardware is whether you want to be able to cope with day time code deployments or major outages, or whether you are willing to take the risk of impact and save hardware costs. And it is days like Black Friday (very high shopping rate days) that matter here.
The following graph shows the impact on a 10K catalog with 1K requests per minute of a complete cache flush at the top of peak. At the spike, 51% of the requests in the first minute are cache misses, dropping back to 16% after 10 minutes, 10% at 20 minutes, 5% at 35 minutes, and so on. This again shows the effect of the long tail.

As would be expected, for a 100K product catalog with 1K requests per minute, purging 10% of the cache every hour would result in the cache hovering around 90% to 95%. However if a lower percentage of the cache is invalidated during the day (1K updates per hour is only 1% of the cache), the cache rate will improve significantly.
Time to Live (TTL)
Okay, let’s go a little crazy here. The above graphs were based on the approach of purging cache entries when a product was updated. What would the graphs look like using a TTL approach instead?
Here I cheat slightly – rather than write a completely new simulator, I am going to simulate by wiping the cache completely every minute, as a rough approximation of a 1 minute TTL value. Remember that the TTL value here represents how long stale content will be still visible to visitors, so setting too long a TTL can result in a bad user experience of being served incorrect content.
(And if you read my previous post on Fastly, you may recall there is the TTL between the web browser and the cache, and the TTL between the cache and the origin. This discussion is all about the TTL between the cache and the origin.)

As you can see, a TTL based strategy of around 1 minute for a 1K catalog with 1K requests per minute looks much worse than purge-on-update based strategies. This is why Magento 2 includes the purge based strategy – it helps! Not all caching strategies are equal.
(For example, the Fastly strategy in my last post of serving stale pages until the updated page is available removes the user impact of cache misses – it becomes purely a hardware capacity issue to keep up with overall load.)
The following is the graph for a 10K catalog with 1K requests per minute with 1 minute TTL.
Egad!
But do note as the requests per minute increases, so will the cache effectiveness.
For the sake of comparison, let’s extend the TTL to 10 minutes with 1K products and 1K requests per minute. In this case the spikes on the graph should be ignored, as a true TTL scheme will flatten out the cache misses. So the cache miss rate is closer to 5%.

Basically if the TTL is long enough with respect to the number of products, then simple caching strategies do work pretty well. The question becomes issues like “how long should you keep a page in the cache if the product is out of stock?” That becomes a business decision, and gets into topics such as should different types of cacheable content have different TTL values.
Conclusions
First repeating some disclaimers: the above are simulations, not real data. The above also only explores cache hit/miss rates – not the actual hardware required to host a site. In addition, this blog post only talked about product pages. Product images are likely to be updated less frequently. Pages containing multiple products will be impacted more frequently. There was also no discussion on the ratio of cacheable to uncacheable pages, which is clearly important to overall site performance.
Really the main point of this blog post was to explore and understand likely cache hit rates and the relative impact of different events. Points of particular note:
- Not all caching strategies give the same performance.
- The size of the catalog does have an impact.
- The arrival rate of requests does have an impact.
- Review your product update strategy, as high update rates does have an impact (small product update rates do not).
- You need to decide if the initial ramp up time from a cold cache matters. If you do this at night, less hardware is required.
- If you want to be prepared to do a 100% cache flush at peak, you do need to factor that into hardware calculations, particularly as your catalog size increases.
And to wrap up, if you have real data from production sites you are willing to share, please let me know. I can then rerun some tests using more accurate data to see if it makes any difference to the overall trends.

can you tell me which tool you used to get these stats . Can you give me the link of that tool .
The tool is called PHP. I knocked up some PHP code that I never got around to cleaning up. Pretty ugly code, and I am sure could be written better/faster. But I got my graphs so I did not care.